What Is Drawdown, and Why It Decides Everything
The asymmetry that makes recovery harder than loss.
Exeisy Intelligence DeskPublished 17 August 2026 · Updated 21 August 20265 min read
Key takeaways
- Drawdown is the decline from an equity peak, and recovery is mathematically asymmetric.
- A 50% drawdown requires a 100% gain to recover.
- Duration matters as much as depth.
- Live drawdown should be expected to exceed backtested drawdown.
- Reduce size in drawdown; never increase it to recover faster.
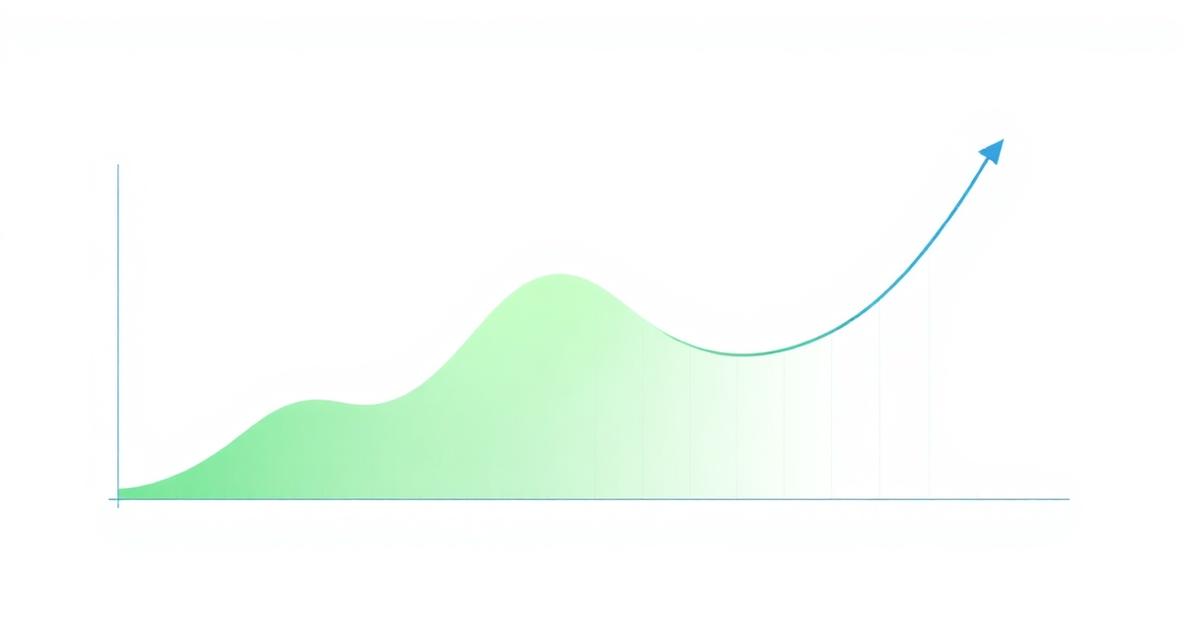
Drawdown is the decline from an equity peak to a subsequent trough, expressed as a percentage. It is the most honest single measure of what holding a strategy actually feels like.
The recovery asymmetry
Losses and gains are not symmetric, because the gain is calculated on a smaller base.
| Drawdown | Gain required to recover |
|---|---|
| 10% | 11.1% |
| 20% | 25% |
| 30% | 42.9% |
| 50% | 100% |
| 70% | 233% |
At a fifty percent drawdown the account must double simply to return to where it started. This single table is the strongest argument for conservative sizing that exists.
Three measurements that get confused
Maximum drawdown
The largest peak-to-trough decline observed over the whole period. It answers: what is the worst this has been?
Current drawdown
The distance from the most recent equity high to now. It answers: where am I standing?
Duration
How long the account remained below its previous peak. A twelve percent drawdown lasting three weeks and one lasting eleven months are entirely different experiences, and duration is the one that ends careers.
Why backtested drawdown understates reality
A historical maximum drawdown is a sample of one path. The future path will differ. A reasonable working assumption is that a live system will at some point exceed its backtested maximum — sizing should be chosen so that this is survivable rather than terminal.
Plan for a drawdown larger than any you have tested. The one that ends a strategy is always the one that was not in the sample.
Controlling it
- Set a maximum acceptable drawdown before deploying, not during.
- Reduce size as drawdown deepens rather than increasing it to recover faster.
- Define a hard stop level at which the strategy is suspended and reviewed.
- Track duration alongside depth.
Exeisy exposes drawdown limits as engine-level controls so a threshold breach halts activity automatically. Details are in Risk Management.
Disclaimer: Content provided for educational and informational purposes. Trading financial markets involves substantial risk and may result in the loss of capital. AI-assisted analysis may contain errors and should be independently evaluated.